How to use the site

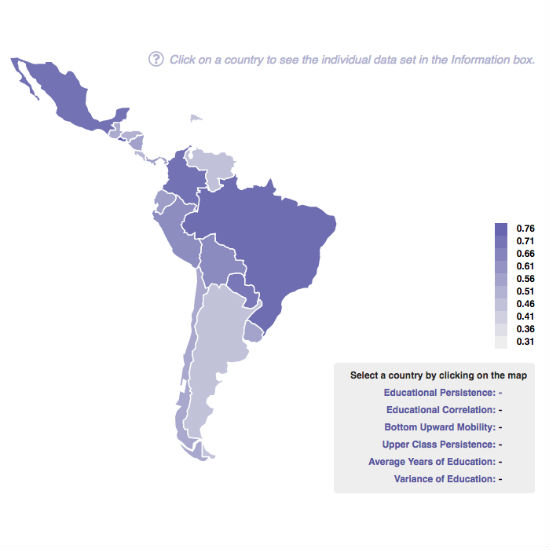
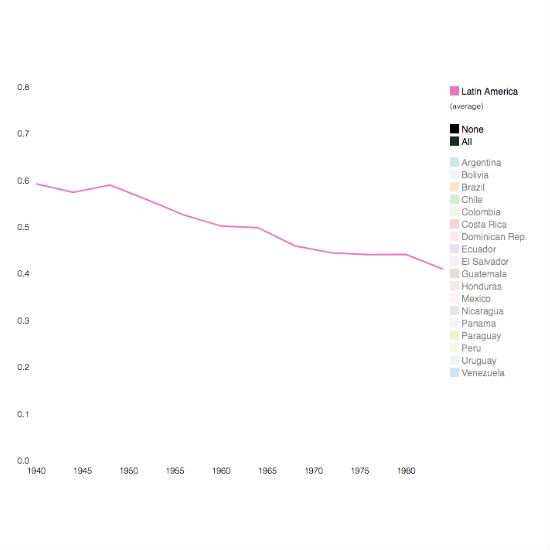
This site shows the evolution of educational inequality and social intergenerational mobility in Latin America for people born between 1940 and 1987. Various indexes for these measures (displayed in the left panel) can be visualized in an interactive map or in interactive trend charts. Furthermore, the data can be downloaded to be used for your own analyses.

Map

Legend

leyenda

  • ph
 
  • -
    / Average/ Promedio
  • Educational PersistencePersistencia Educativa
    -
    -
  • Educational CorrelationCorrelación
    -
    -
  • Bottom Upward MobilityMovilidad Ascendente
    -
    -
  • Upper Class PersistencePersistencia de la clase alta
    -
    -
  • Average Years of EducationAños de Educación Promedio
    -
    -
  • Variance of EducationVarianza de Años de Educación
    -
    -
[Year of birthAño de nacimiento]
 
[1940,1943]
[1944,1947]
[1948,1951]
[1952,1955]
[1956,1959]
[1960,1963]
[1964,1967]
[1968,1971]
[1972,1975]
[1976,1979]
[1980,1983]
[1984,1987]
 

Index

b
bstd
cohort
educ
prob high
prob low
var

About the Index

The Educational Persistence is the most widely used mobility index in the intergenerational mobility literature in economics. It is the slope coefficient from a linear regression of children's years of education on the years of education of their parent with the highest degree. This index captures absolute changes - e.g. because of educational expansions - as well as relative movements of families within the distribution. The higher the index the lower is social intergenerational mobility.

The Educational Correlation or Standardized Persistence is the corellation between parents' and children's years of schooling. This index is neutral to educational expansions and measures just relative changes; i.e. if families change their position in the educational distribution from one generation to the next. The higher the index the lower is social intergenerational mobility.

Average years of education

The Upper Class Persistence measures the probability of individuals with high educated parents (at least a secondary degree) to attain a secondary school degree.

The Bottom Upward Mobility measures the probability of individuals with low educated parents (less than a secondary degree) to attain a secondary school degree.

Variance of years of education

Select a country by clicking on the map

Click Date of Birth years to see results on the map.